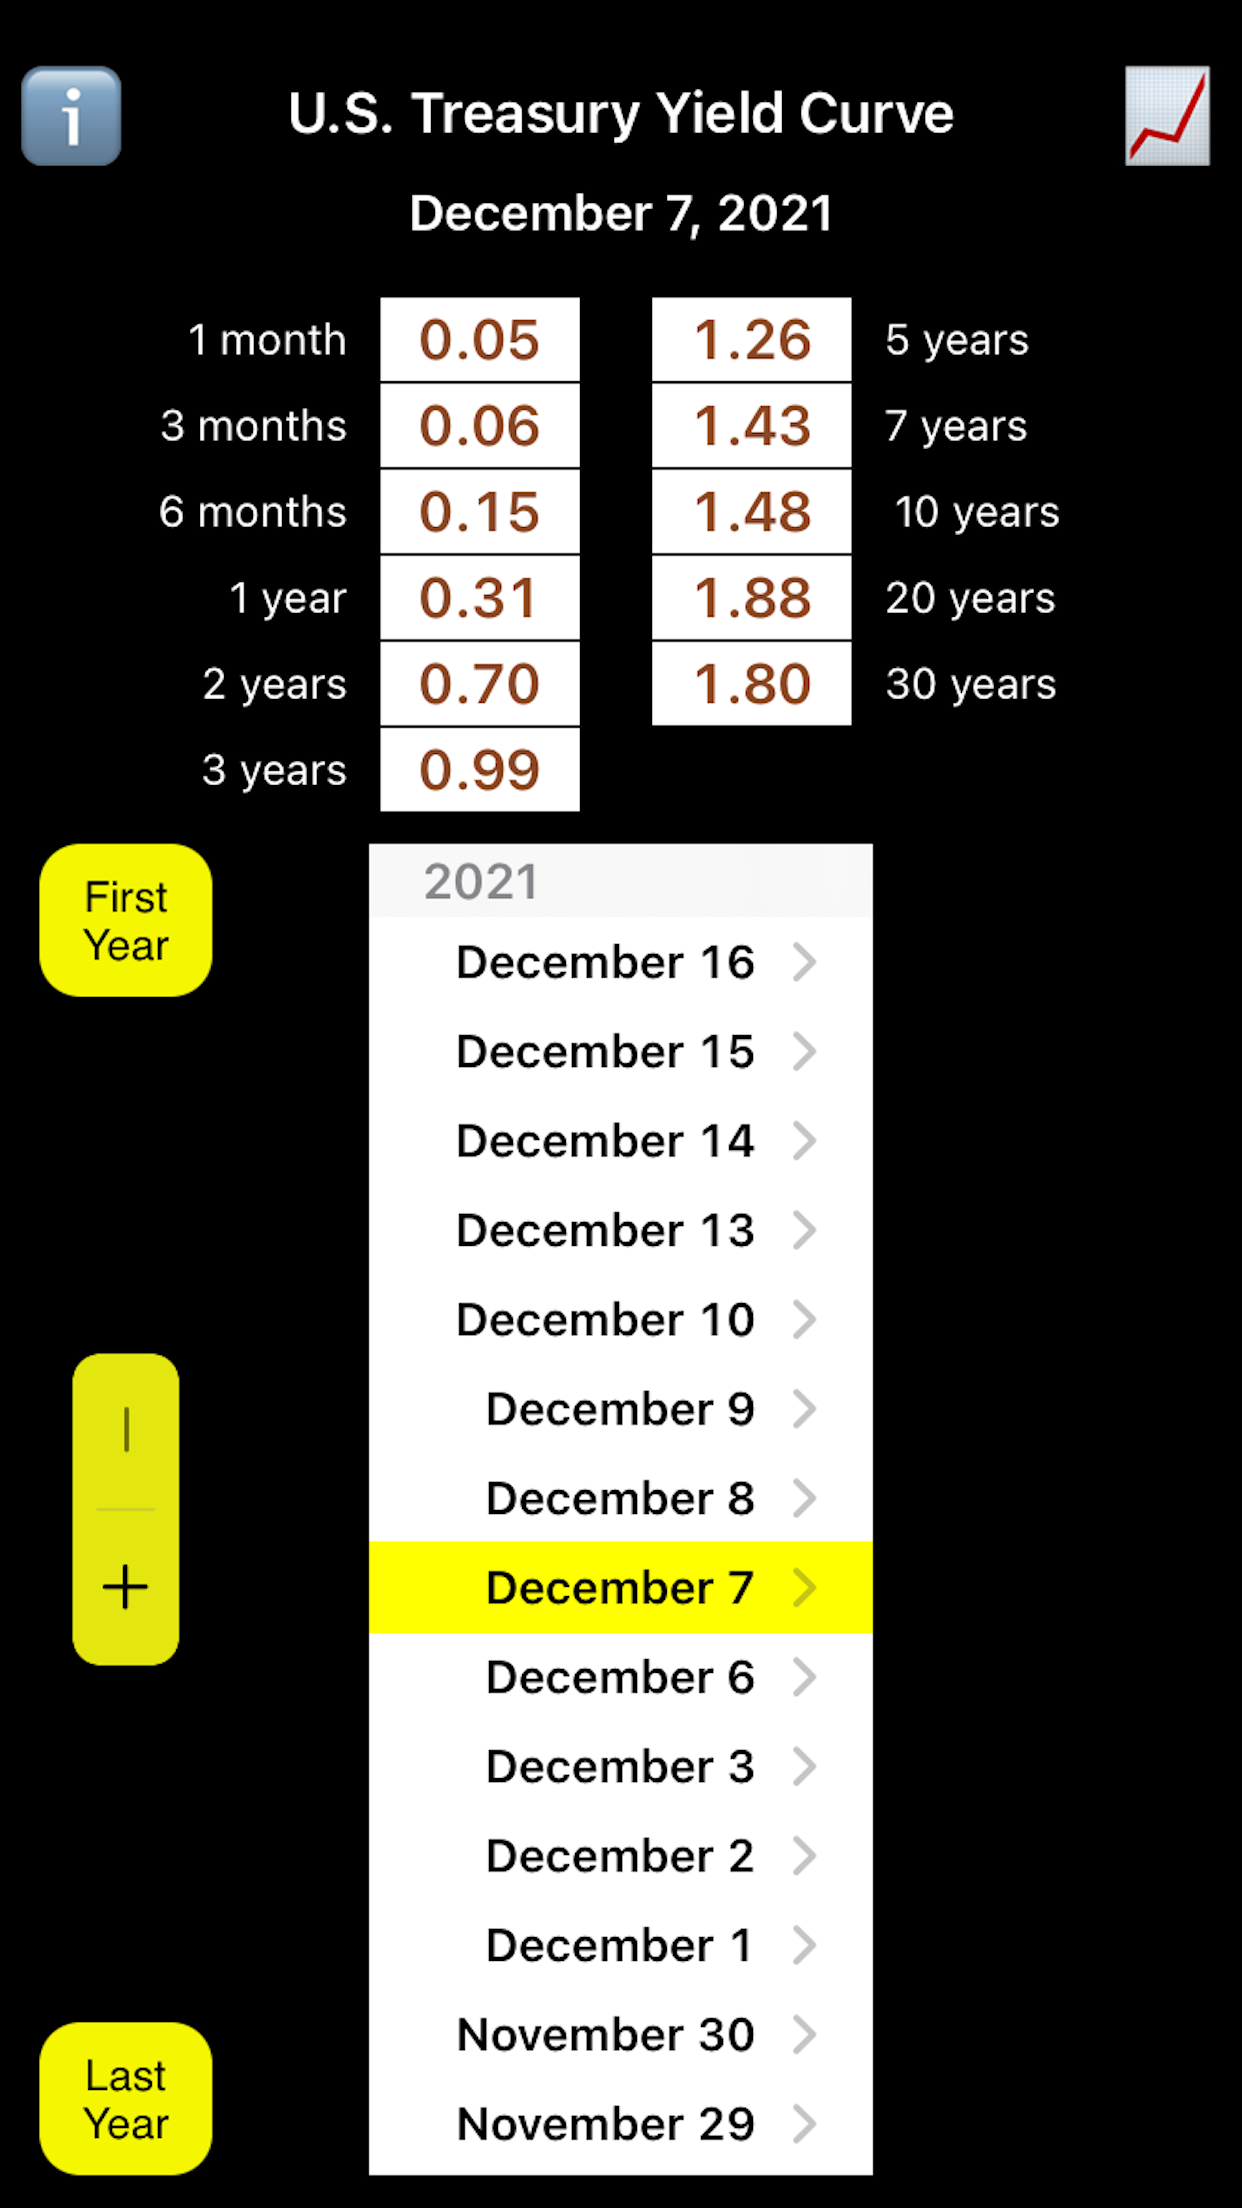
Treasury Yield Curve
The U.S. Department of the Treasury in conjunction with the Federal Reserve
System provides yields for bills, notes, and bonds at
various maturities for each day in which the instruments are available for trading.
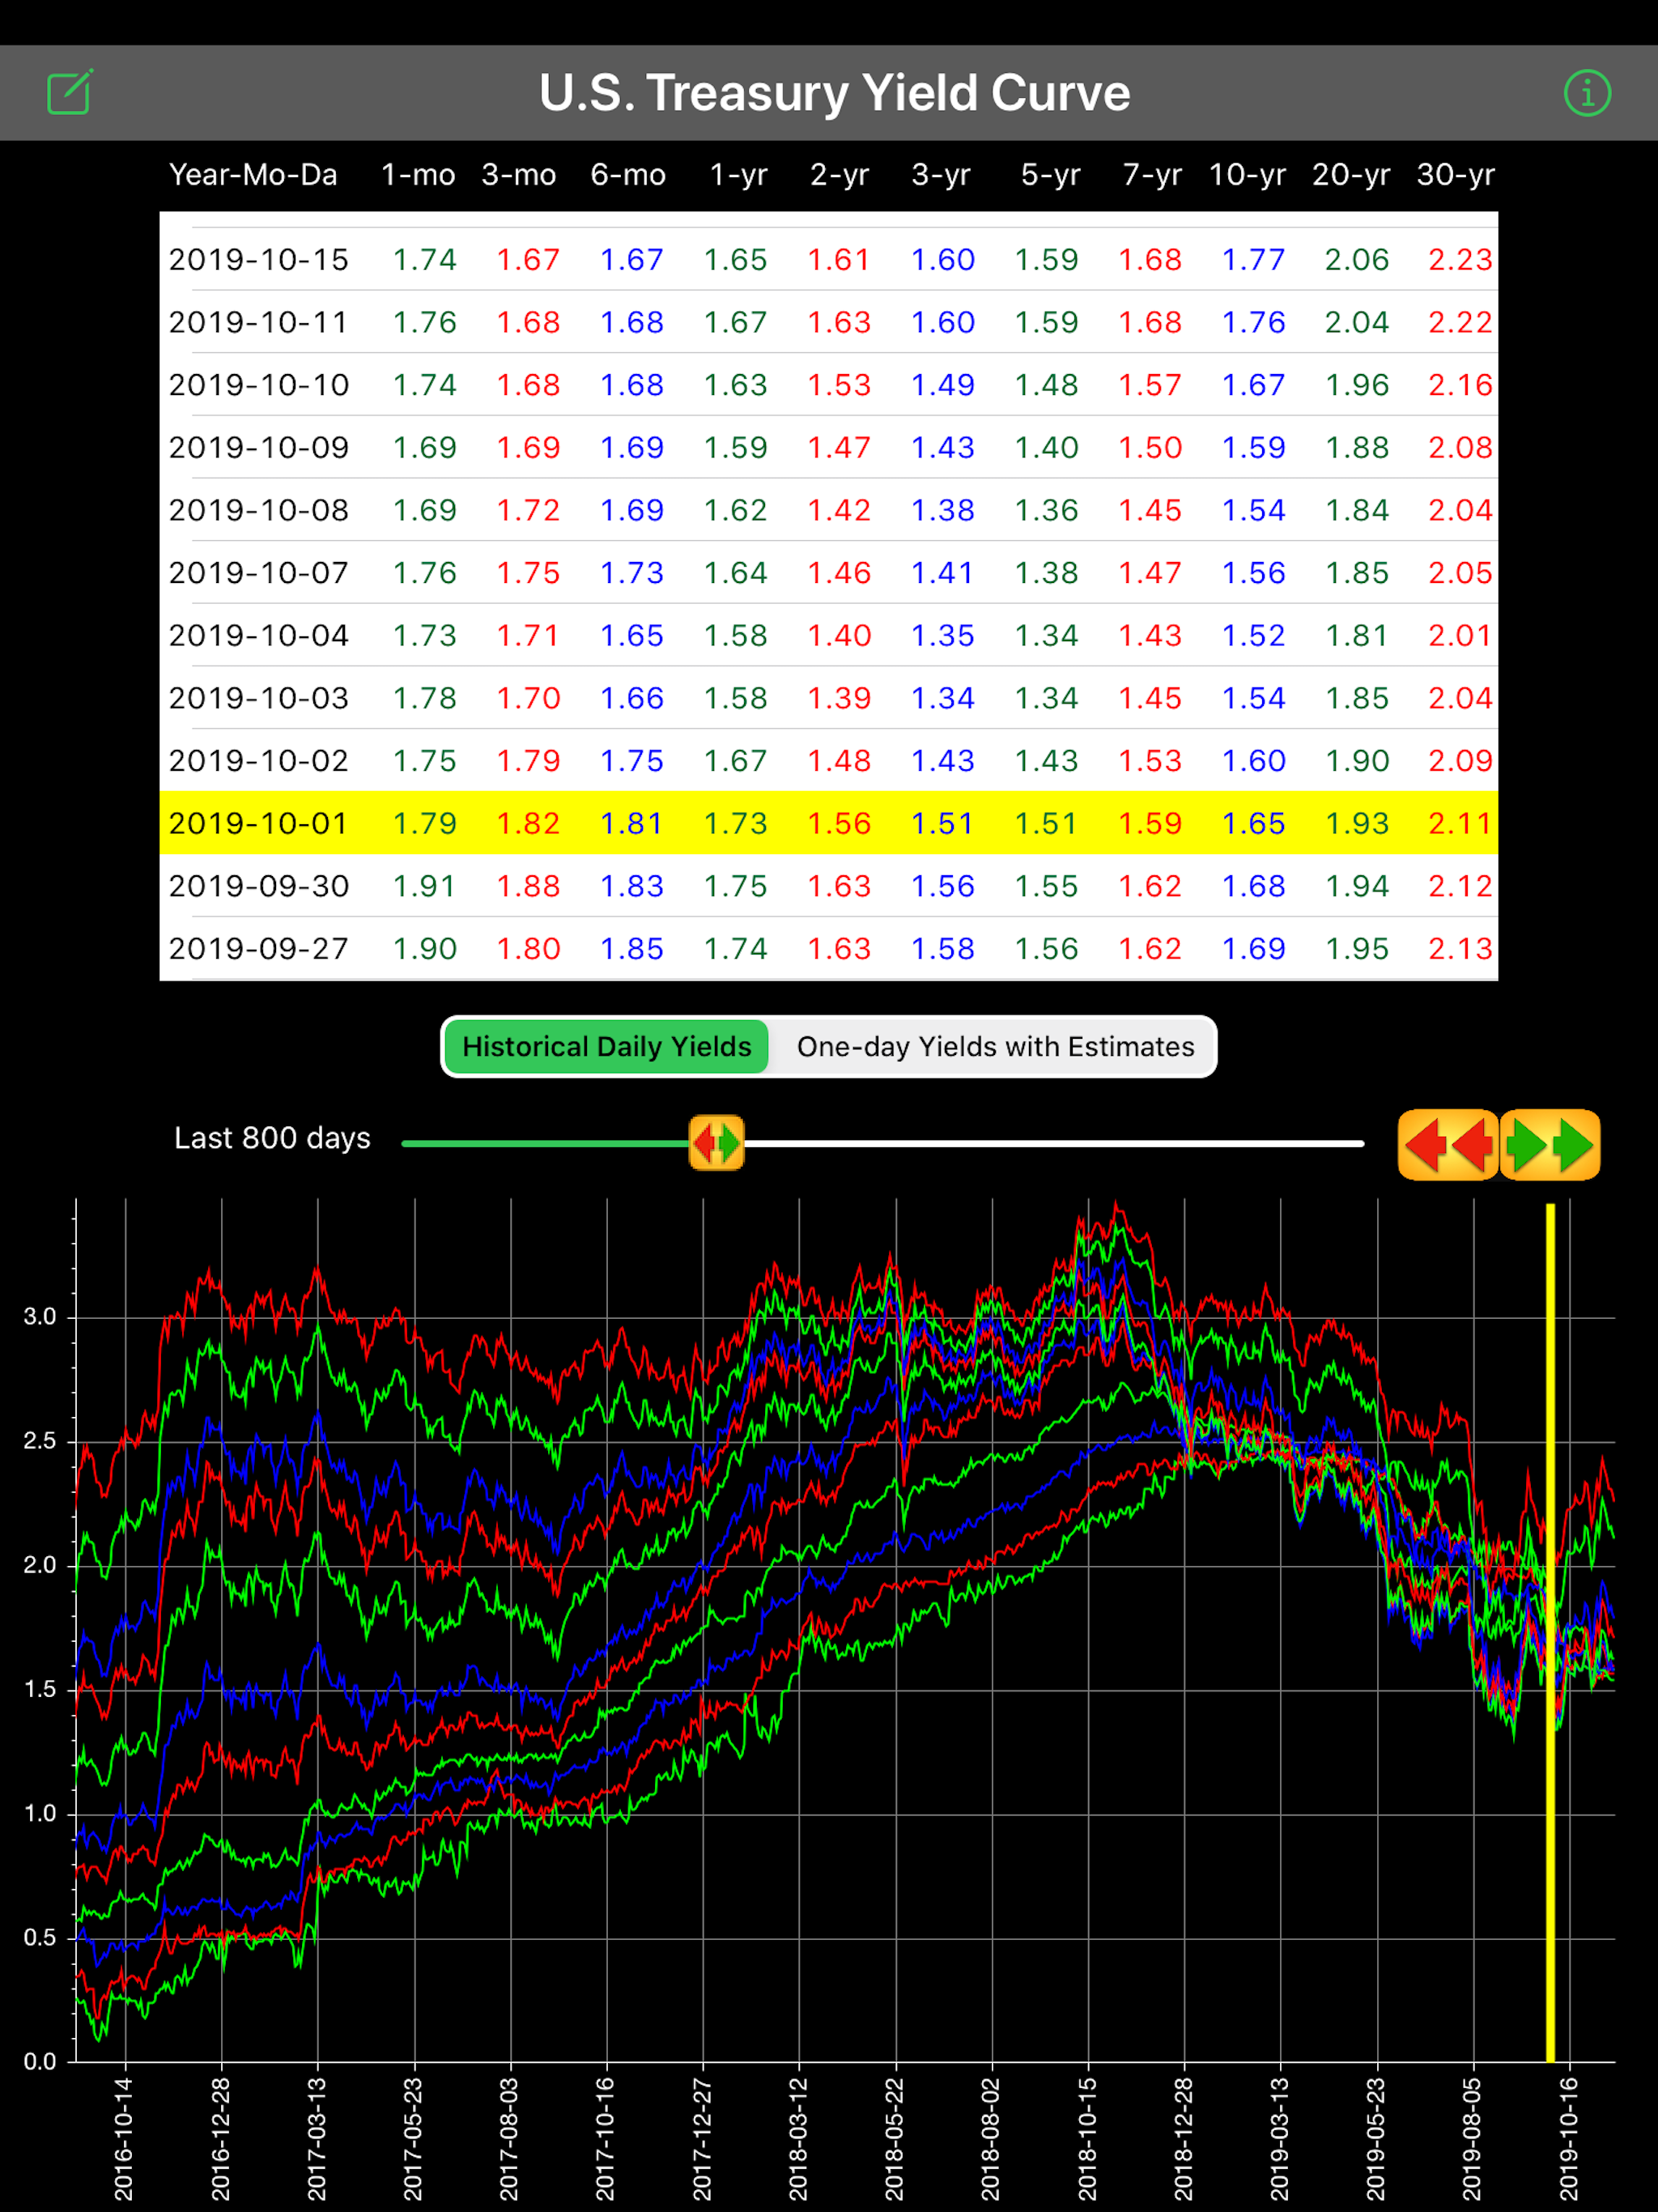
This app shows those yields starting on the first trading day of January 2010 onward.
The Treasury provides daily updates on-line lagged by 24 hours and the app retrieves
the updates when it is connected to the Internet.
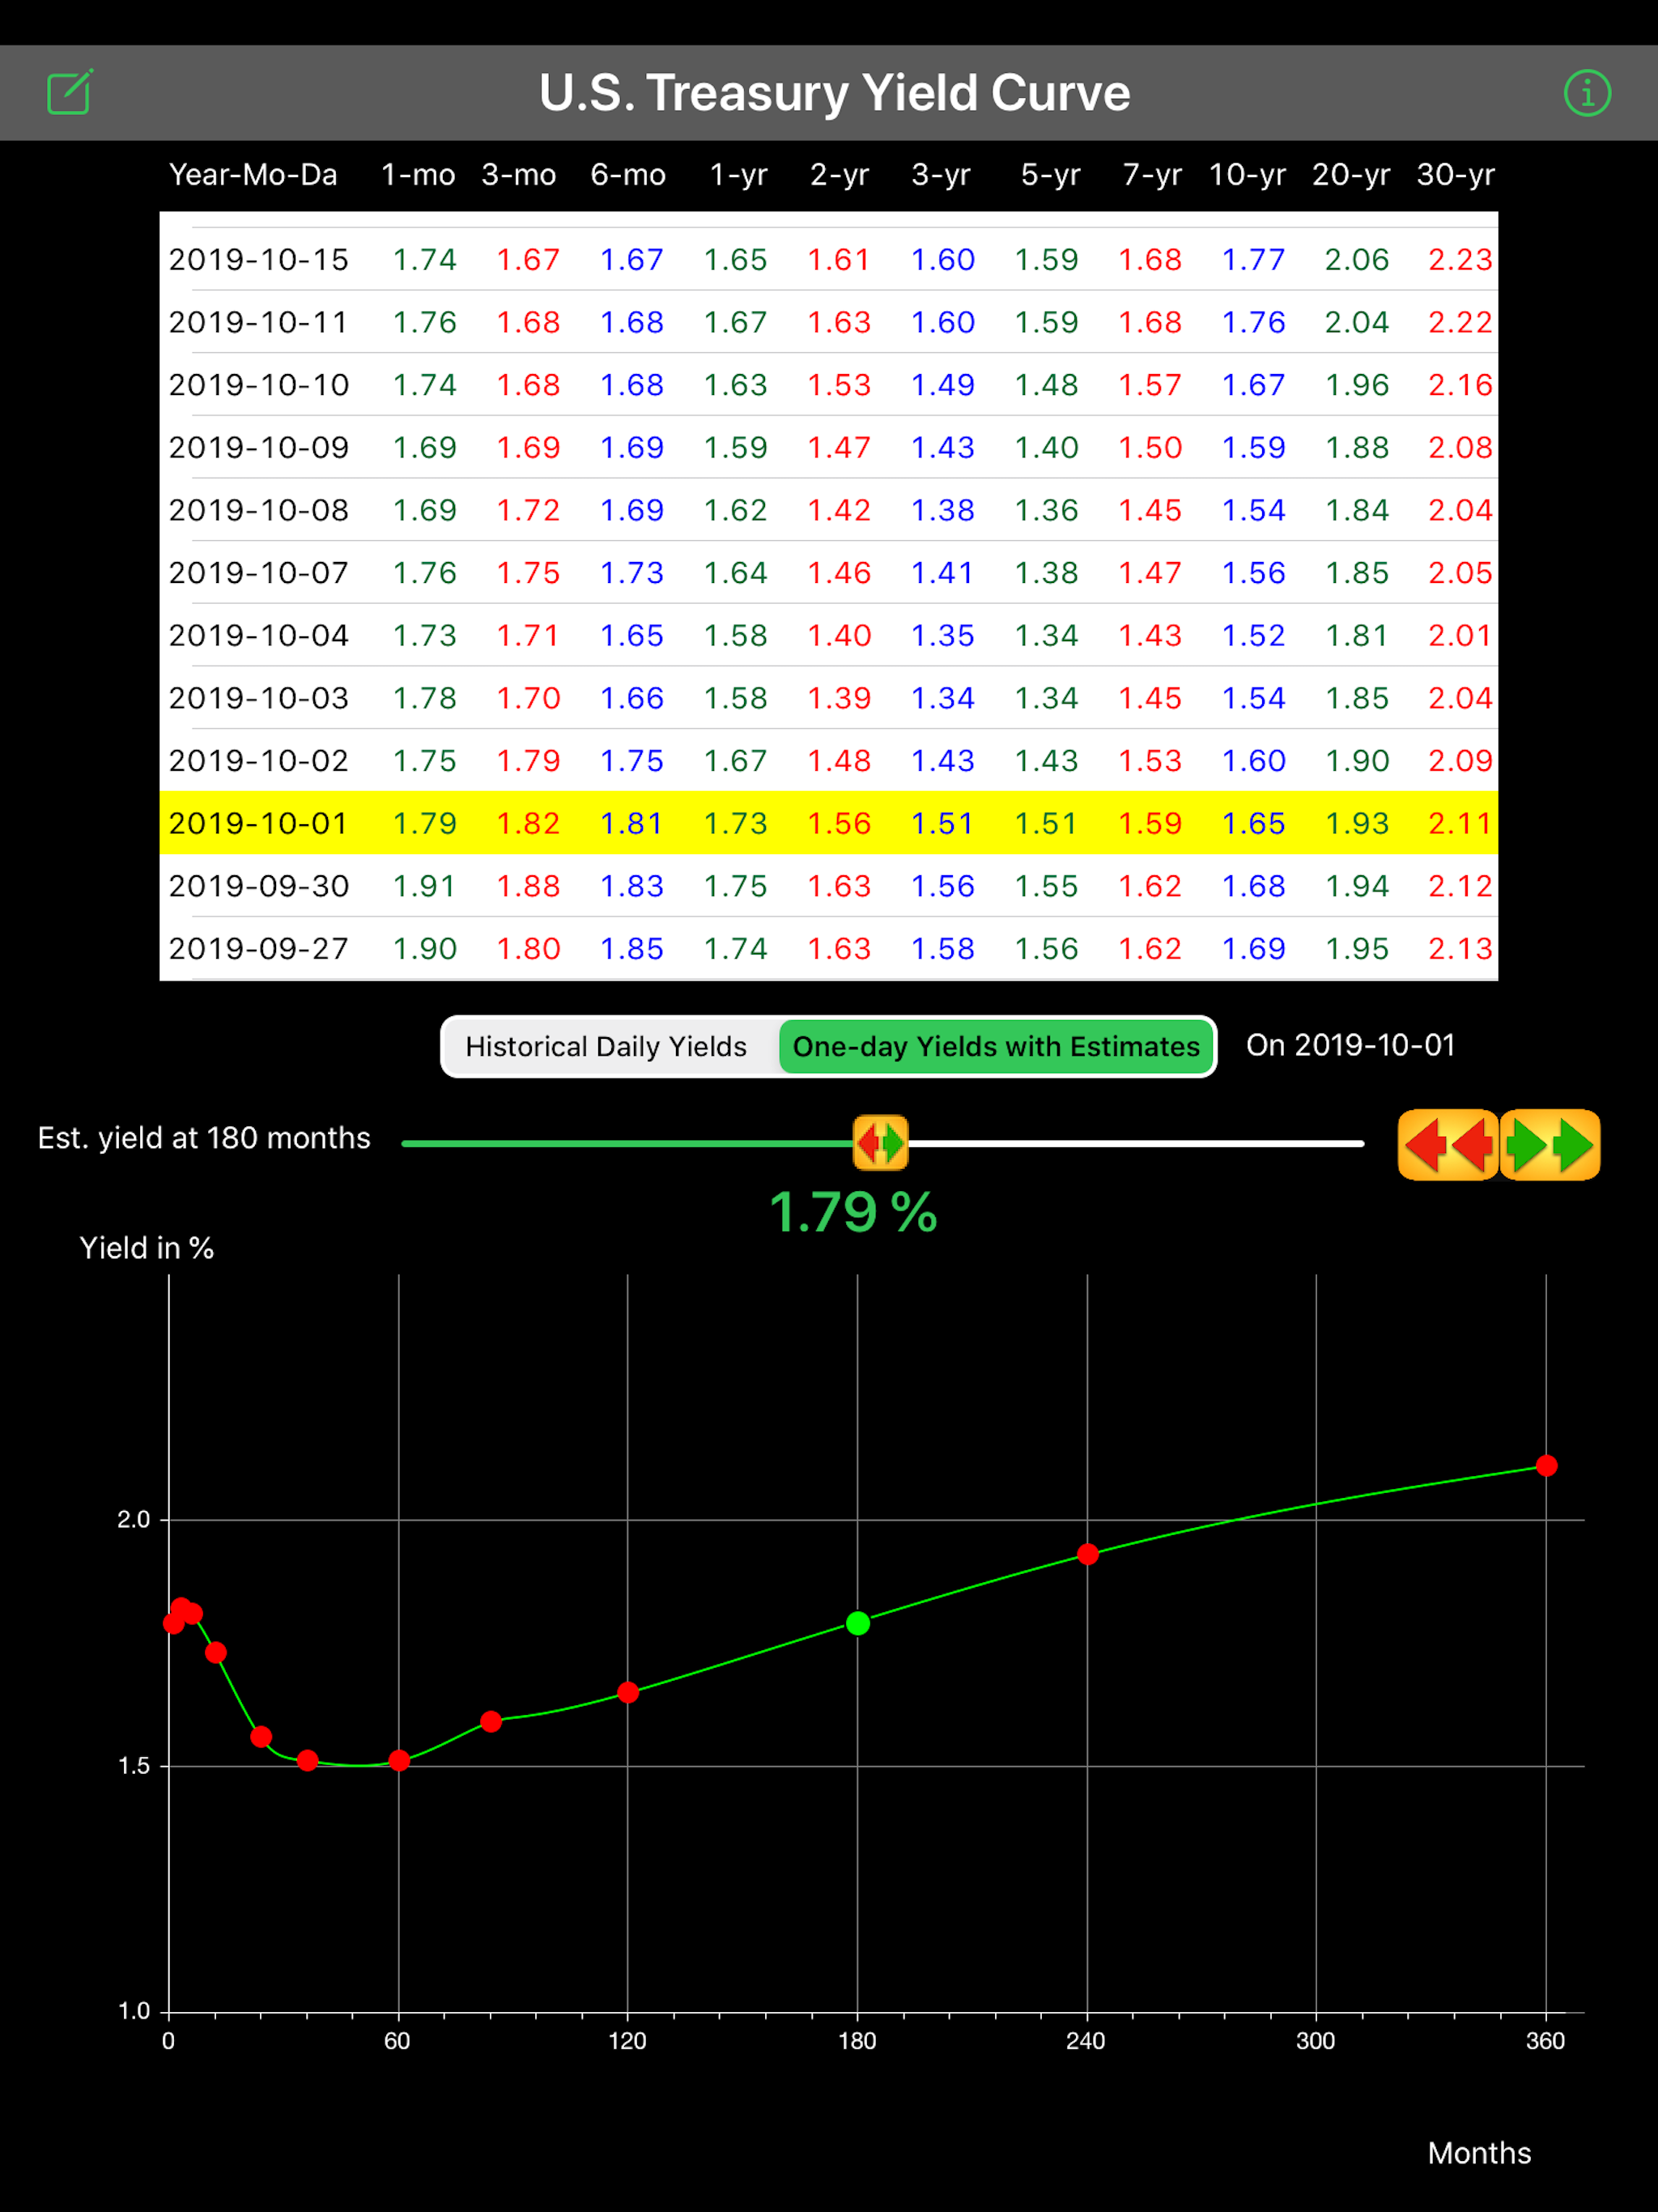
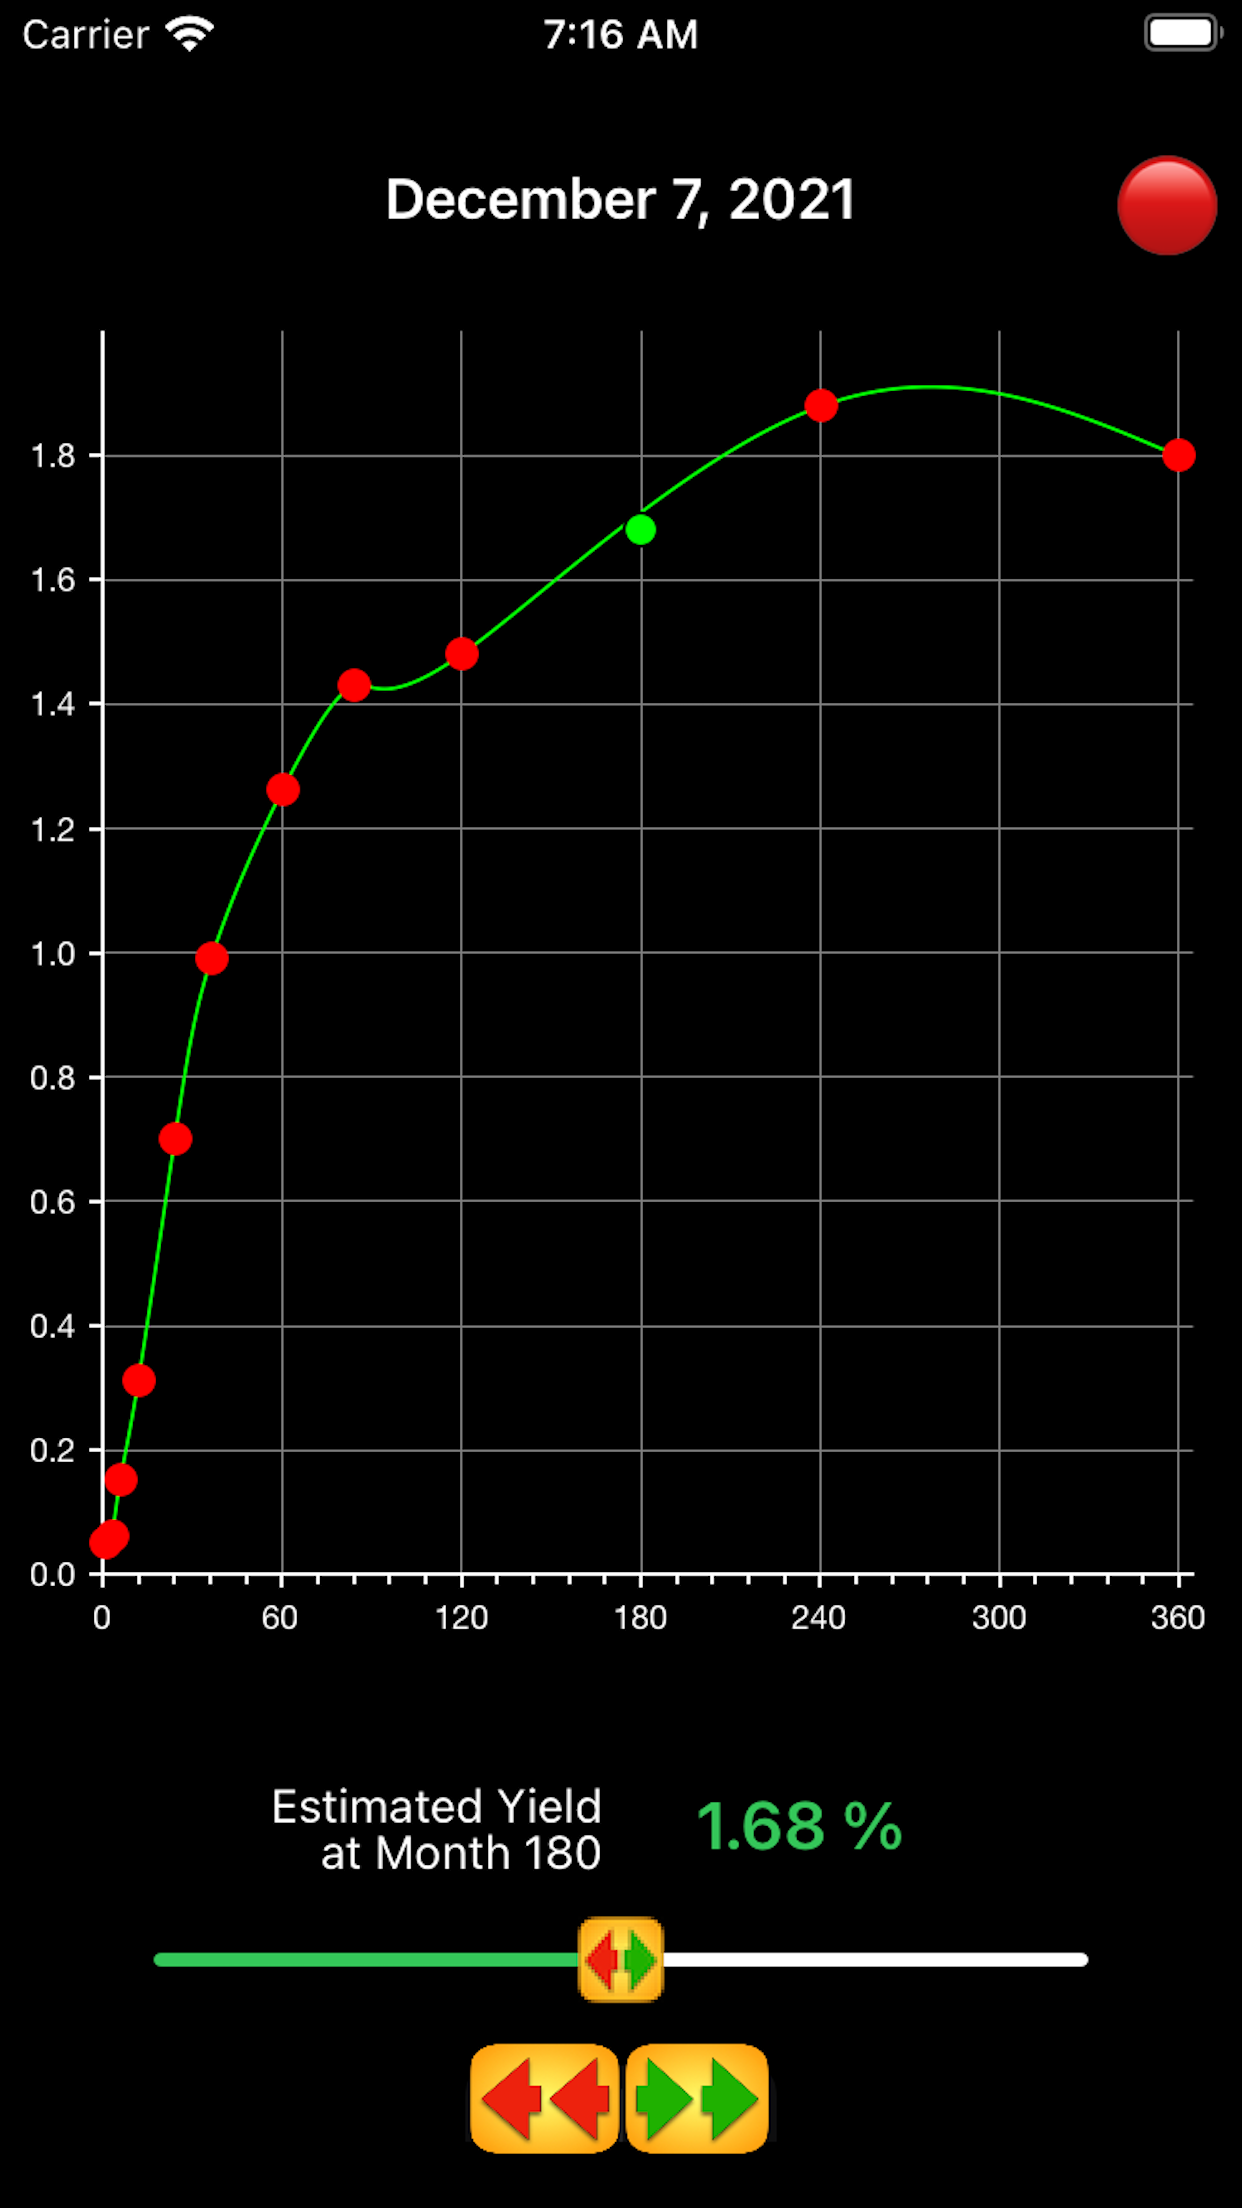
Additionally, you may plot the yield curve and get an estimate of the yield for all
months from 1 to 360 (1 month to 30 years) by means of a slider.
The estimated yields are computed by linear interpolation between the actual yields.
Moving the slider shows the estimate for any month you choose as well as a simple plot of the actual data.
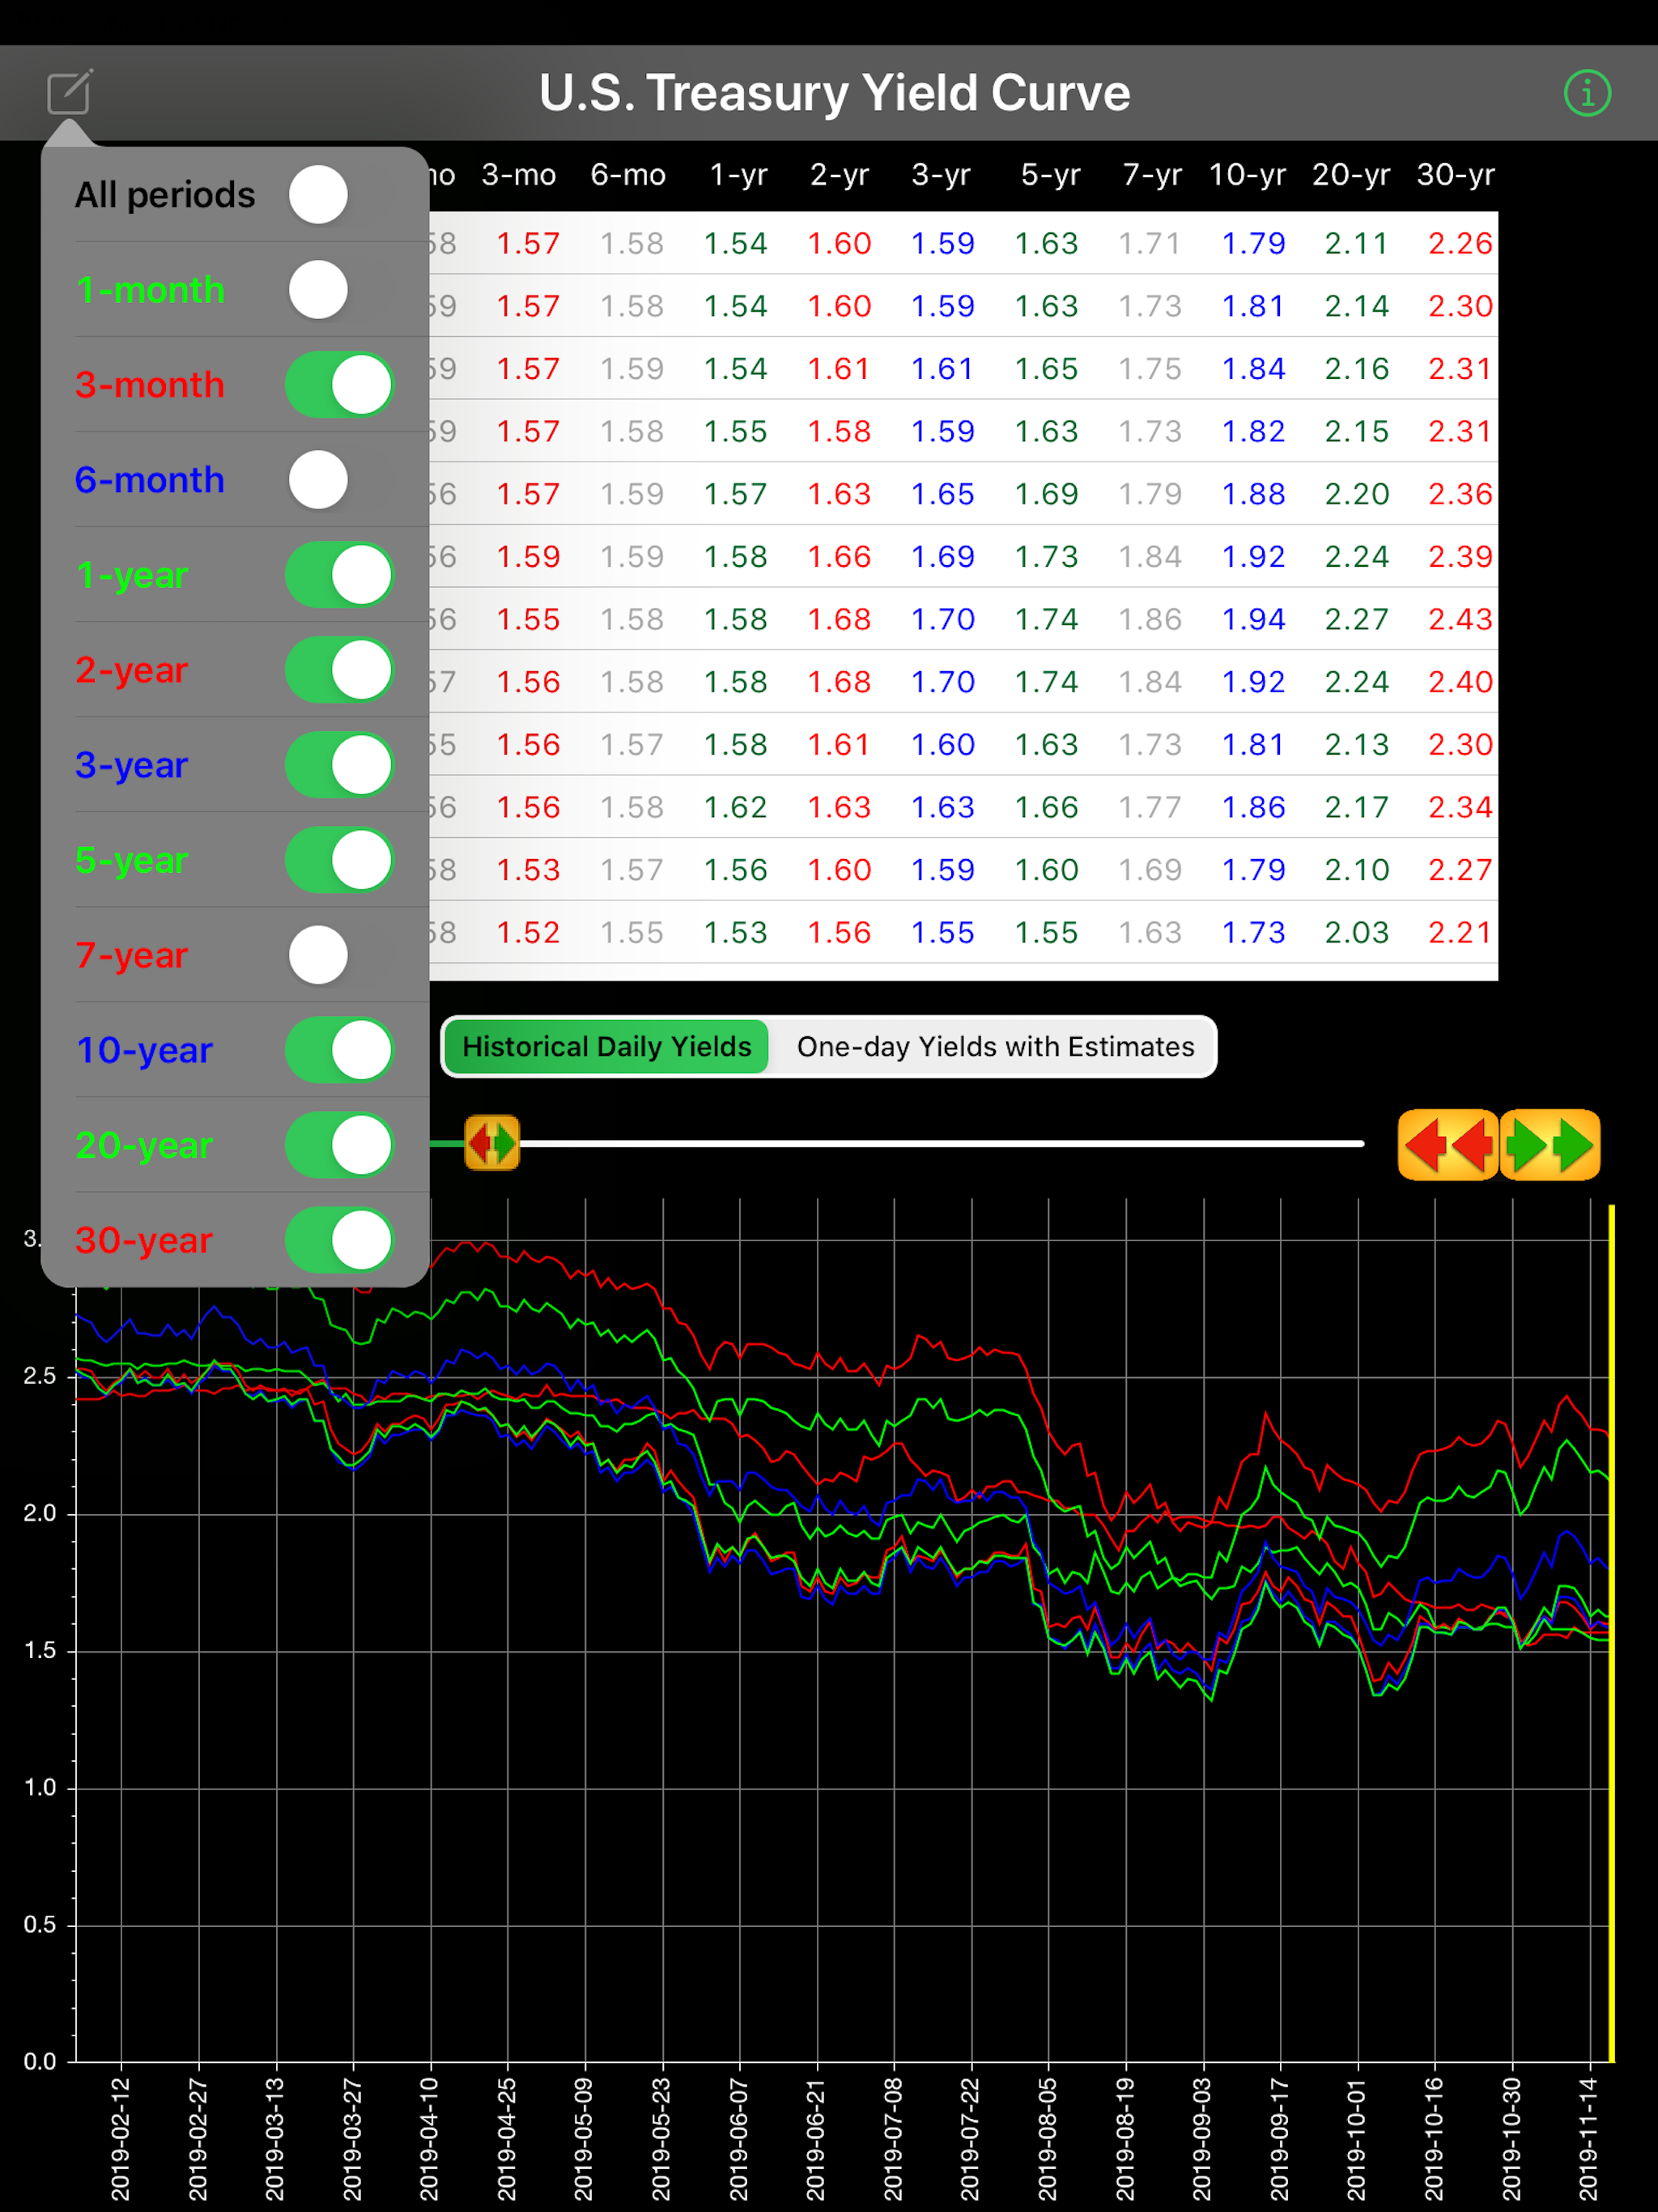
With each new update, look at the history on your loaded app. If there are gaps within say the last year
most easily identified by abrupt changes in the historical yields, then simply delete the
app on your mobile device and download it again to fill in the blanks.
|


