Confidence Interval
In statistics, confidence intervals can be used to express the degree to which
sample results are reliable.
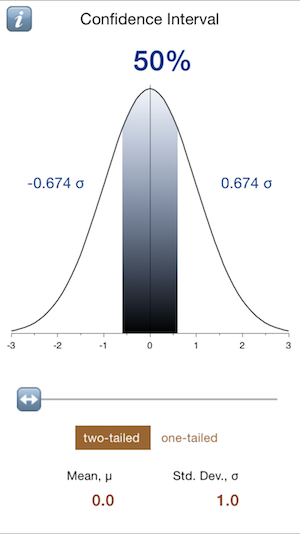
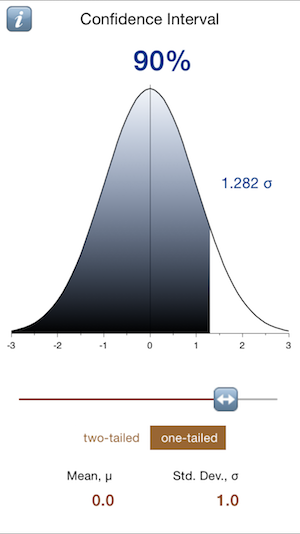
Confidence intervals are often stated in terms of a percentage like 90% or 95%.
When the sample or population distribution is the Normal (bell-shaped) distribution,
the confidence intervals can be represented as a number of standard deviations (σ)
above or below the sample mean (μ).
Moving the slider beneath the graph will vary the confidence intervals from 50% to 99%.
Additionally, you may choose the two-tailed confidence intervals or the one-tailed interval
by tapping the button beneath the slider.
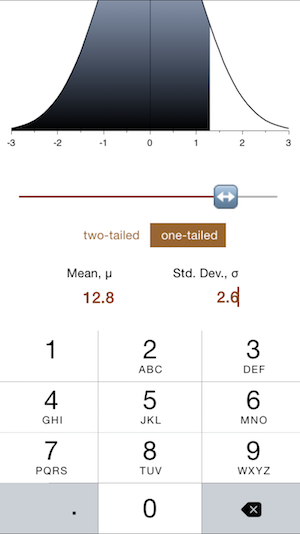
In this application, you may chose the standardized Normal distribution with μ=0.0 and
σ=1.0 or some other values for mean and standard deviation.
|


